After defining a cohort, the default patient list view is displayed:
 Cohort builder: List View.
The user then has the option of selecting other views, namely the Gender/Age chart view, or Concept chart view. Selecting the Gender/Age link, the following is shown:
 Gender/Age chart view.
This shows the cohort patients separated according to gender and age. Clicking a pie slice filters the cohort to include only the corresponding patients:
 Gender/Age chart view after filtering by adult female patients.
That's about it for this view. The Concept view offers some more functionalities...
 Concept chart view
By default, the CD4 Count frequency distribution is shown. The concept values are divided into ranges, and the chart shows the number of patients in each range of values. Hovering on a bar shows the correspondent range and number of patients in that range:
 Hovering frequency distribution bar.
The bars are clickable and, just as the Age/Gender chart, clicking filters the data shown. In this case, clicking the [277-314] range, produces the following:
 After clicking range.
For numeric concepts, there is also the option to view a Patients vs Values chart. This plots the values for every patient in the cohort and can be useful for detecting critical patients. When available, the critical values for the concept are also shown:
 Patients vs Values.
Both types of charts (Frequency and Values) allow zooming into specific areas, by clicking the reddish band on the X axis and defining a zoom "window":
 Zooming.
Resulting in:
 After zooming in.
Zooming out can only be "simulated" by going back to the previous view, using the browser Back button. A different solution needs to be studied for this
And that's what's been keeping me busy in a glance... Some other remarks:
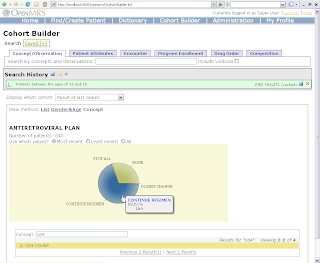 Coded concepts are plotted in a frequency pie chart:

- Datetime concepts are plotted in bar charts, but the Patients vs Values chart is not available (not applicable)
- Browser back button works, to step back after zooming in, even though one never actually leaves the cohort builder page. Though I love AJAX, the fact that it breaks the back button is possibly one of its most annoying aspects. Luckily there are several solutions to it, and after some research and tweaking, this one did the trick.
And what I guess will keep me busy for some time:
- Buttons or links to go back to previous view or go back to original cohort.
- The option of using the most recent, the least recent or all of the observations is still under development.
- There is a code refactoring in progress, to aggregate values directly on the database instead of in Java in order to improve performance. This implies massive refactoring in DWR services, the JSP cohort portlet and in the Flash charting library as well, so I imagine this will take quite some time...
1 comment:
Thanks for posting.....
----------------------------
Andrew
Link Building
Post a Comment